
ᐅ Vitocal 300 A – in use for over a year now. I have a few questions...
Created on: 18 Jan 2016 19:13
S
sucksgsh
Hello everyone,
I have been living in our KfW 70 house since September 2014 and now have a few questions about heating.
I have a Vitocal 300 air-to-water heat pump installed indoors in the basement.
There is also a 200L (53 gallons) hot water tank connected.
The underfloor heating covers about 130m² (1400 ft²).
The room temperature is set to 21 degrees Celsius (70°F). So far, there has been no night setback.
The heating curve settings are: slope 0.4 – level 0K.
The seasonal performance factor displayed is 4.3.
The domestic hot water temperature is 55 degrees Celsius (131°F).
During this period, I have used about 5000 kWh of electricity – which seems quite high to me.
Additionally, the compressor has already run for 3800 hours and has cycled 1800 times. Assuming a lifetime of 40,000 hours, that would amount to just about 10 years.
Is this normal? The electricity consumption and compressor operating hours seem relatively high to me.
Unfortunately, I am a complete beginner when it comes to heating and have relied entirely on my heating technician. Hopefully, I can find some answers here.
I was told it might be normal to heat more in the first year because the house is not fully dried yet (brick construction).
Thanks and best regards
I have been living in our KfW 70 house since September 2014 and now have a few questions about heating.
I have a Vitocal 300 air-to-water heat pump installed indoors in the basement.
There is also a 200L (53 gallons) hot water tank connected.
The underfloor heating covers about 130m² (1400 ft²).
The room temperature is set to 21 degrees Celsius (70°F). So far, there has been no night setback.
The heating curve settings are: slope 0.4 – level 0K.
The seasonal performance factor displayed is 4.3.
The domestic hot water temperature is 55 degrees Celsius (131°F).
During this period, I have used about 5000 kWh of electricity – which seems quite high to me.
Additionally, the compressor has already run for 3800 hours and has cycled 1800 times. Assuming a lifetime of 40,000 hours, that would amount to just about 10 years.
Is this normal? The electricity consumption and compressor operating hours seem relatively high to me.
Unfortunately, I am a complete beginner when it comes to heating and have relied entirely on my heating technician. Hopefully, I can find some answers here.
I was told it might be normal to heat more in the first year because the house is not fully dried yet (brick construction).
Thanks and best regards

The hot water reaches about 45°C (113°F). What you can still do is set all the thermostatic valves in the rooms to 24-25°C (75-77°F) and control the setback via the heat pump, so that the temperature throughout the house stabilizes at 21-22°C (70-72°F).
According to the heating consultant, legionella should not be a problem since the water rarely stands still for long.
According to the heating consultant, legionella should not be a problem since the water rarely stands still for long.
Saruss schrieb:
What is the exact period for the consumption data? 2014 could mean two years, but in any case, you are already in the second heating season. Then the value could be reasonable. Did the heat pump also heat the screed?
1900 hours per year is okay, and the number of starts as well, meaning the unit doesn’t seem to be short-cycling excessively.The heating system started operation in September 2014. So this is now the second winter. The screed was not heated—that was done by another device.
I tracked some data during the year, but it was somewhat neglected... Attached is a screenshot
The information in the screenshot is a) incomplete and b) difficult to evaluate without a diagram (with fluctuating periods, etc.). Additionally, the fragmented temperature data is not very conclusive.
Here is an example from my side for comparison. Among other things, I log the consumption (not just the total, but the daily progression) of the heat pump and the temperature, and at the end of each day, I calculate the total consumption and the heating degree days. The heating degree days represent the average temperature difference between outside and inside throughout the day. Outside measurements are taken near the ground in a location sheltered from wind and direct sunlight (so it might be slightly warmer in winter or cooler in summer than, for example, at the house wall higher up), while inside measurements are taken in a room with typical temperatures. The diagram lacks, unscientifically, axis labels, etc.: The x-axis shows the days since October 1, 2015, and the y-axis shows kWh for electricity consumption and °C (°F) for heating degree days. As with you, the electricity consumption includes domestic hot water preparation (basically a small offset on the curve compared to heating operation).
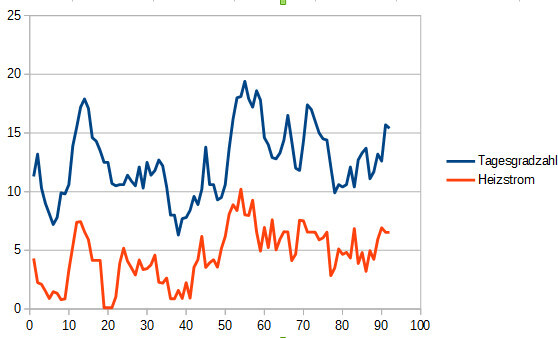
What can also be clearly seen, besides consumption, is what the annual heating costs depend on: very closely on the daily/annual heating degree days. This is due to the linearity of heat losses. There are certainly some exceptions, e.g., cooler days with a lot of sunshine.
If you have both the annual heating degree days and consumption data for some days, you can very well compare your costs/consumption at different temperatures, as well as heating load at certain temperatures, or the actual insulation performance of the building compared to standard calculations, etc. (of course, if you consider the heat produced rather than the consumption in kWh). This is very useful for comparisons. Hopefully, this helps you with ideas for optimization or assessing the current state of your system.
Here is an example from my side for comparison. Among other things, I log the consumption (not just the total, but the daily progression) of the heat pump and the temperature, and at the end of each day, I calculate the total consumption and the heating degree days. The heating degree days represent the average temperature difference between outside and inside throughout the day. Outside measurements are taken near the ground in a location sheltered from wind and direct sunlight (so it might be slightly warmer in winter or cooler in summer than, for example, at the house wall higher up), while inside measurements are taken in a room with typical temperatures. The diagram lacks, unscientifically, axis labels, etc.: The x-axis shows the days since October 1, 2015, and the y-axis shows kWh for electricity consumption and °C (°F) for heating degree days. As with you, the electricity consumption includes domestic hot water preparation (basically a small offset on the curve compared to heating operation).
What can also be clearly seen, besides consumption, is what the annual heating costs depend on: very closely on the daily/annual heating degree days. This is due to the linearity of heat losses. There are certainly some exceptions, e.g., cooler days with a lot of sunshine.
If you have both the annual heating degree days and consumption data for some days, you can very well compare your costs/consumption at different temperatures, as well as heating load at certain temperatures, or the actual insulation performance of the building compared to standard calculations, etc. (of course, if you consider the heat produced rather than the consumption in kWh). This is very useful for comparisons. Hopefully, this helps you with ideas for optimization or assessing the current state of your system.
Unfortunately, I cannot log data automatically with my heat pump – I have to record everything manually, and I often forget. Over the past four days, I have used about 21 kWh per day.
During the day, the temperature here is around -4°C (25°F), and at night it drops to about -10°C (14°F). I will try to keep a daily record.
During the day, the temperature here is around -4°C (25°F), and at night it drops to about -10°C (14°F). I will try to keep a daily record.
sucksgsh schrieb:
Unfortunately, I can’t log data from my heat pump—I have to record everything manually, and I keep forgetting. The last 4 days, I used about 21 kWh per day. During the day, it’s around -4°C (25°F) and at night -10°C (14°F). I will try to record data every day. However, the overall information, especially regarding the house, is still too limited to make a proper comparison.
Otherwise, I roughly estimate your heating degree days at around 28 based on your values. With an average outdoor temperature of -7°C (19°F), your (quite good) heat pump (depending on the exact model, which one exactly??; roughly reading from the COP diagram) has a COP of about 3 (assuming a heating curve slope of around 0.4 and a set indoor temperature of 21°C (70°F) → supply temperature around 30°C (86°F)). Adding a few kWh for hot water, you have generated approximately 50 kWh of heat per day for the house. This corresponds to an average heating load of 2.1 kW.
I would say that this is a reasonable value for your floor area and temperature. At -15°C (5°F), this would correspond to a heating load of 2.7 kW. If your numbers are correct and I haven’t completely miscalculated after today’s especially tiring workday, even 20% more would still be acceptable.
In summary, this suggests the house is probably reasonably insulated (both in terms of execution and not just in the calculations), and the consumption is correspondingly low.
Service life and number of start cycles are not really an issue with modern heat pumps (at least not with the compressor). They usually include current limiters for compressor start-up, and a runtime of about 2,000 hours per year is basically normal. For ground-source heat pumps, the borehole is also designed for these runtimes. Additionally, you average about 2 hours of runtime per start, which is not bad. Some people here struggle with very different issues (for example, only 5-15 minutes per start). From my “layperson’s” perspective, this looks like it’s within a good range.
Similar topics